Data Visualization Samples
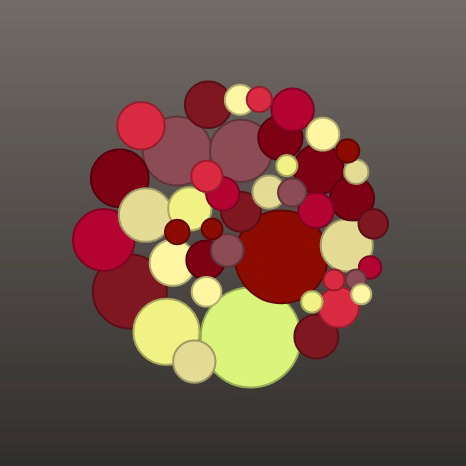
Bubble Chart
Top 10 Wine Grape Production in Top 5 Wine-Producing Countries
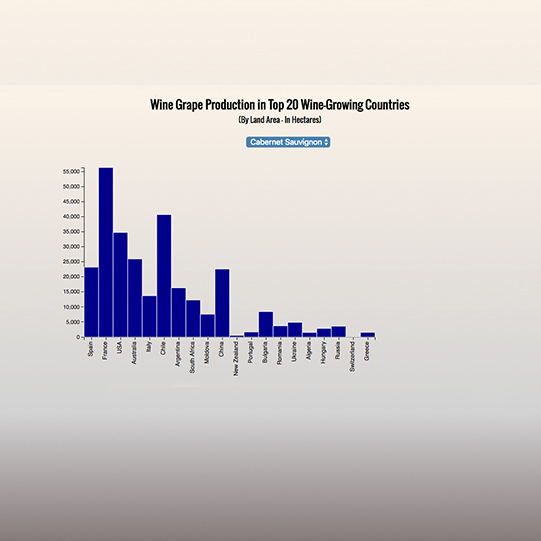
Bar Chart 1
Wine Grape Varietal Production in Top 20 Wine-Growing Countries
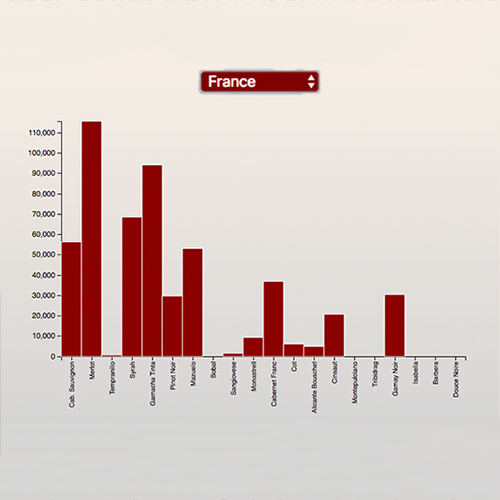
Bar Chart 2
Top 20 Red Wine Grapes in Top 20 Wine-Growing Countries
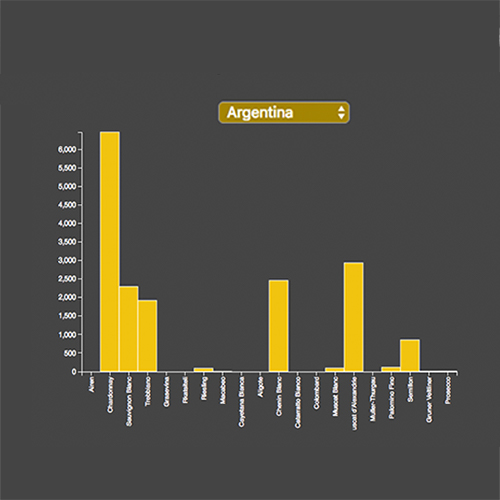
Bar Chart 3
Top 20 White Wine Grapes in Top 20 Wine-Growing Countries
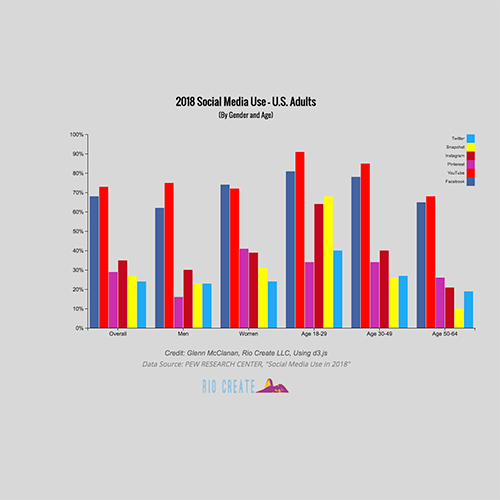
Grouped Bar Chart
2018 Social Media Usage - Gender & Age
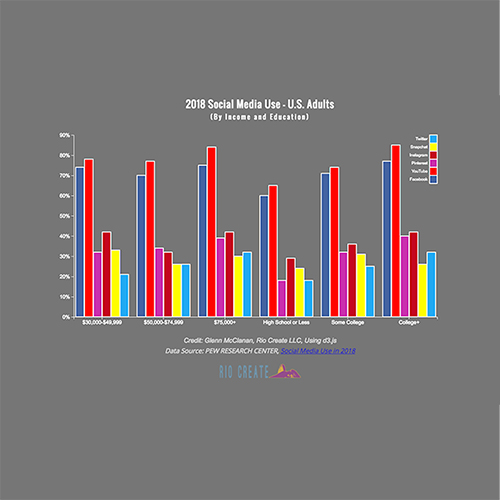
Grouped Bar Chart
2018 Social Media Usage - Income & Education

Line Chart
Historic wine production, 1835-2016

Streamgraph
Historic wine production, 1835-2016
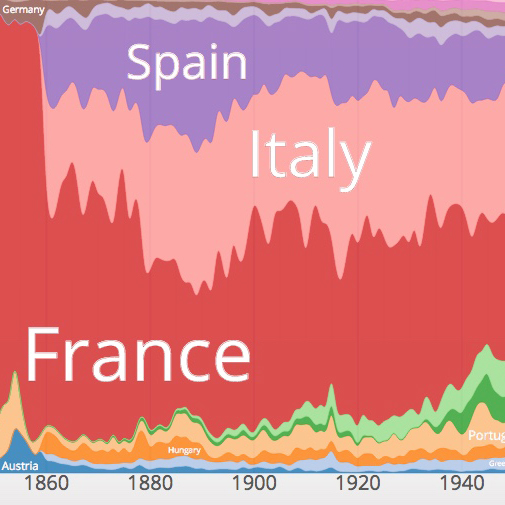
Streamgraph - Scaled
Historic wine production, 1835-2016